It’s currently impossible to accurately determine the number of crashes, injuries, and fatalities caused by drowsy driving, but numbers increase yearly. Crash investigators say they can look for signs that drowsiness played a role, but the signs aren’t always clear or definitive. Police and hospital reports are the primary sources for drowsy driving numbers, so it’s unsurprising that experts believe published figures vastly underestimate the true impact.
Drowsy Driving: Risk Factors & Mitigating Technology
While drowsy driving can lead to accidents at any time of day, NHTSA says certain factors are typically at play. Most often, these accidents occur early morning or late afternoon when a driver’s circadian rhythm is at a low point. Drivers are typically alone and run off the road at high speed without braking. Highways and rural roads are the most common location.
Drowsy driving detection and alerting systems have come a long way since Volvo and Ford first introduced the technology in 2007 and 2008, respectively. Volvo’s early solution monitored the vehicle’s movements and assessed whether it was being driven in a controlled or uncontrolled way – drivers got an alert if something seemed awry. Toyota’s early solution was first to use an infrared camera plus AI to monitor eyelids for signs of distracted or drowsy driving. GM, BMW, Ford, and Mercedes-Benz followed suit in 2010 with similar approaches.
The advent of drowsiness notifications meant drivers were newly aware of their fatigue levels and could take precautions. But four years after the mainstream availability of the technology, statistics remained alarming. The AAA Foundation for Traffic Safety reported in 2014 that six percent of all crashes involved drowsy driving, and 21 percent of fatal crashes involved drowsiness. In 2017, a National Transportation Safety Board study found that drowsy driving was the probable cause in almost 40 percent of highway crashes investigated.
Seven years in, was the technology making a difference relative to fatal and injurious crashes?
Research In The Hawkeye State
Dr. John G. Gaspar, Director of Human Factors Research at the University of Iowa’s Driving Safety Research Institute, home of the National Advanced Driving Simulator (NADS-1 simulator) – whose team is focused on driver state monitoring and effective safety countermeasures – decided to take a closer look. In a study published in 2017, his team revealed that drowsiness detection was effective on short drives (typically one hour or less). Still, it was unknown if the technology was effective on long drives during which drowsy driving crashes are more common.
As the technology advanced, drowsy driving numbers continued to be concerning. A 2021 survey by the AAA Foundation for Traffic Safety found that 17 percent of drivers reported driving drowsy within the past 30 days. And in 2022, the National Sleep Foundation reported that drowsy driving is responsible for 6,400 U.S. deaths annually.
In January of 2022, Dr. Gaspar gathered his team to look at the efficacy of drowsiness detection and countermeasures – specifically drowsiness notifications (DN) and lane departure warnings (LDW) – on driver performance and driver behavior during long (four-hour) early morning or late-night drives. The study included 72 males between the ages of 21 and 30 driving on the NADS-1 simulator for three and half hours, starting at 2:00 am, after being awake for a minimum of 18 hours.
Participants were offered phony financial incentives to complete their drives to replicate the motivational tradeoffs of real-world drowsy driving situations, where drivers balance their desire to reach a destination with the need to preserve their safety. They were told they would only be compensated if they completed their drives safely. They were also told they would receive a bonus if they reached their destination in under four hours – enticing them to push through and complete their trip despite being drowsy.
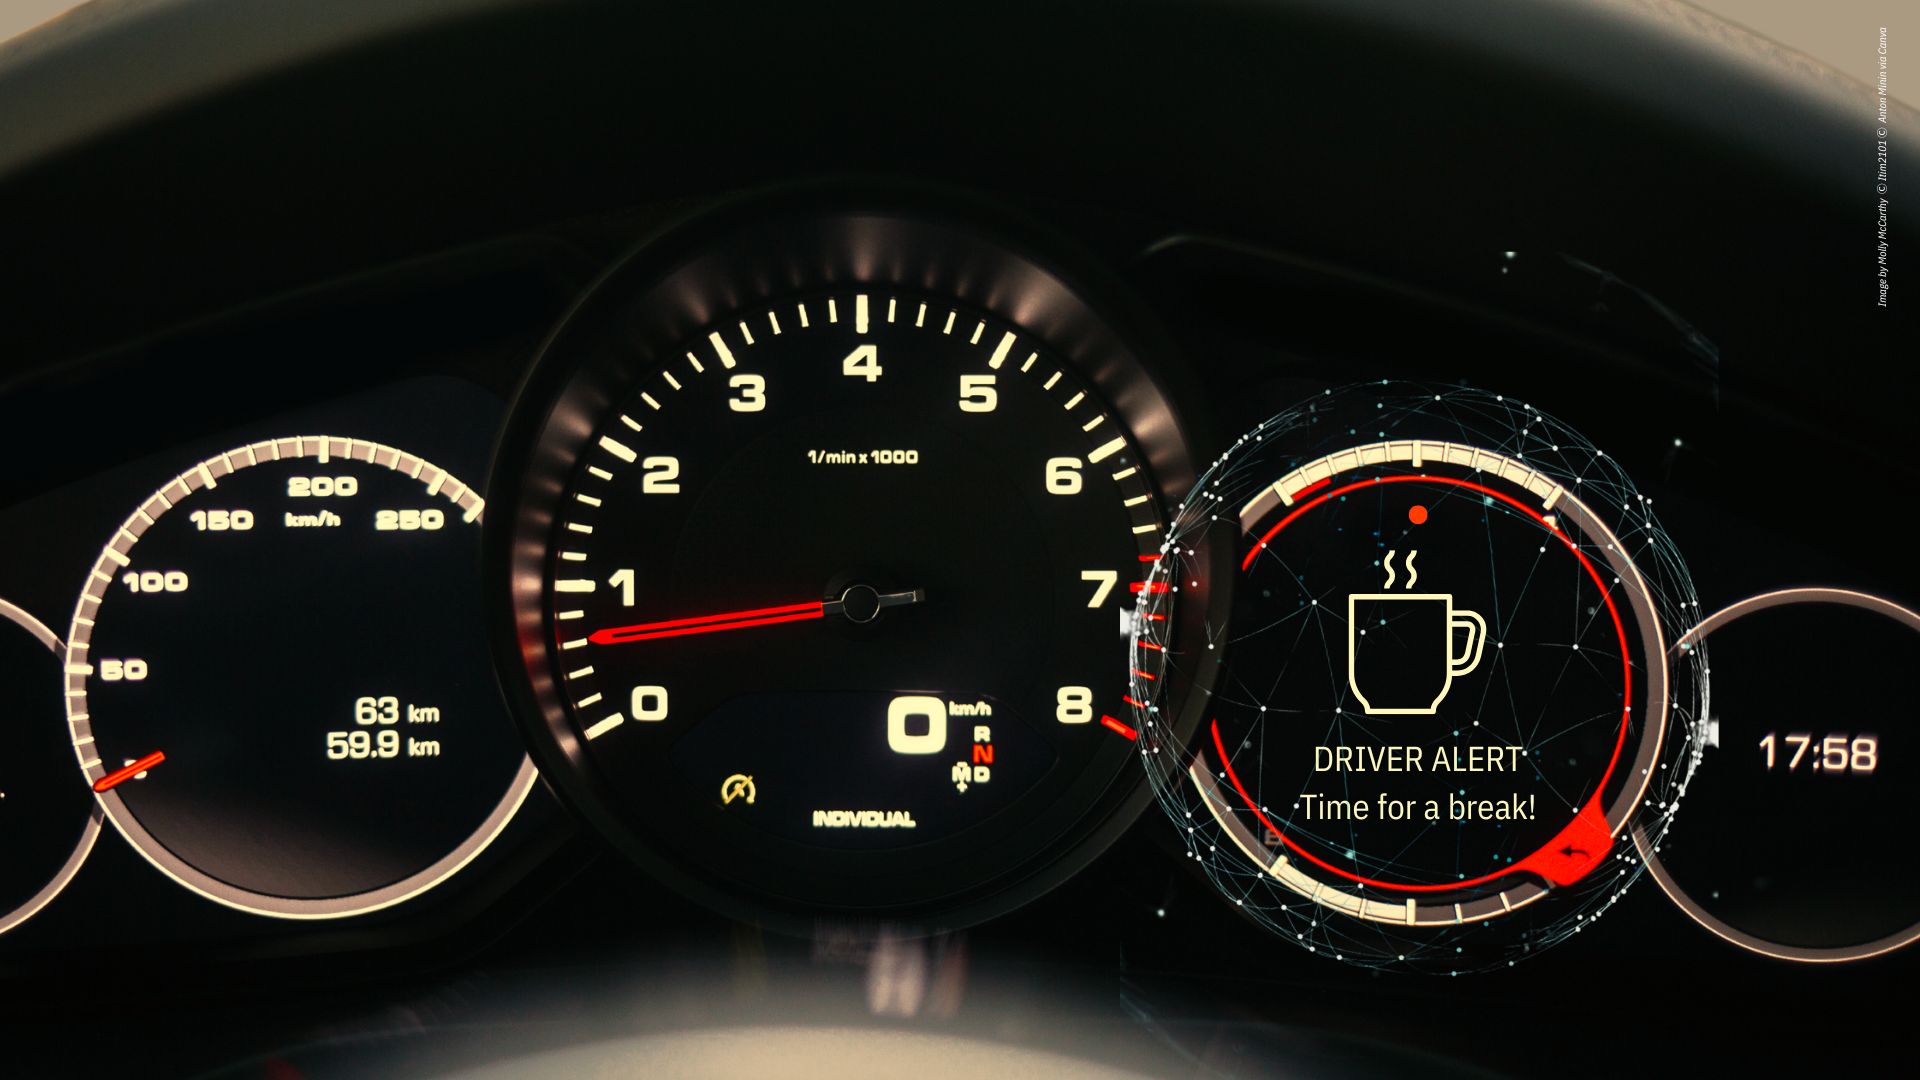
The study’s drowsiness notifications were based on a temporal steering and eye-tracking algorithm that indicated the driver’s level of drowsiness. When drivers rated high on the drowsy scale, a coffee cup icon appeared on the dash display, and they received auditory and text alerts prompting them to take a break. Auditory and visual lane departure warnings were triggered when their vehicle came within 12 inches of a lane line without the driver signaling. Regardless of whether they stopped to rest, visual and auditory alerts remained active until the driver cleared them.
Dr. Gaspar’s team revealed their findings in May 2023. They concluded that lane departure warnings made no difference when it came to driver performance (staying in one’s lane) or behavior (deciding whether to take a rest break). They also found notifications made no difference regarding the frequency or timing of breaks.

Johns Drowsiness Scale
For an industry insider’s perspective on the study, I reached out to Dr. Trefor Morgan, General Manager of R&D for Optalert. His team has extensive expertise in drowsiness and impairment detection. They are 15 years into research, development, and manufacturing of a system that quantifies driver impairment in real time. It also allows for soft countermeasures that inform drivers in the early stages of drowsiness before they are dangerously impaired.
Optalert’s core algorithm relies on the Johns Drowsiness Scale (JDS), a metric developed by Optalert founder Dr. Murray Johns, a world-renowned authority on sleep medicine and research. The algorithm derives 64 parameters from upper eyelid movements (i.e., blinks) and produces an aggregate figure from zero to 10 on the JDS of how impaired someone is from drowsiness. The company’s system displays, for drivers to see, an objective biomarker that spans full wakefulness through to extreme drowsiness, encouraging drivers to plan their routes and rest stops accordingly.
The Optalert system is used worldwide by industrial drivers in mines, where the company has shown it reduces risk by 88 percent. It is also available to fleet and passenger vehicle OEMs as a software development kit (SDK). Two separate studies by Harvard Medical School and the Institute for Breathing and Sleep concluded JDS is the most accurate metric for predicting drowsiness-induced performance failures in drivers. According to the company, 90 independent and peer-reviewed studies have validated JDS.
In Dr. Morgan’s review of the University of Iowa study, he found it provided valuable insight. “Compared to most of the studies we look at, this one is very strong in terms of the choice of impairment metrics,” he said.
Do Boring Drives Present More Risk?
One question Dr. Morgan had for the NADS-1 research team was about the route driven by the study participants. “If they drove on a racing simulator or winding road, such a challenging route would stimulate the driver and wake them up,” he said. “If the route was a long, dull stretch of highway, that would better represent real-world conditions and likely increase their drowsiness level.”
In talking with the University of Iowa researchers, I learned both their studies (the earlier short-drive study and the most recent long-drive study) used a highway loop that could be driven infinitely. “Traffic levels were very sparse,” said Dr. Chris Schwarz, a NADS-1 research engineer on Dr. Gaspar’s team. As described by Dr. Schwartz, the routes emulated nighttime highway driving with minimal traffic and hardly any “road furniture” (i.e., buildings or signs) to look at. “It was supposed to be monotonous driving and represent many parts of the country, though maybe not around our bigger cities,” he said.
Dr. Morgan was pleased that, during the study, drivers could take breaks for restroom use and caffeine intake and that the NADS-1 researchers completed the study’s sleepiness questionnaire, the Stanford Sleepiness Scale (SSS), during those breaks and not while participants were driving. Doing so added variability, but in this case, it is acceptable because it mimics real-world conditions, Dr. Morgan said. For example, at a rest stop on a long-haul trip, drivers can chat with others, go to the bathroom, and drink coffee.
“In the European General Safety Regulation (GSR), the driver is asked for their drowsiness level every five minutes,” Dr. Morgan explained by contrast. “This inadvertently wakes them up and does not reflect real-world conditions.”
Potential Data Pollution
Paul Zubrinich, Optalert’s Chief Marketing Officer, suggested this manner of data collection muddies study results. Drivers struggling to stay awake are, by default, impaired and unable to self-assess. In addition, the most effective stimulus to reduce drowsiness and rouse someone from sleepiness is to engage them in conversation. Zubrinich used an example of an investigator talking to a driver where, through conversation, the driver becomes more alert, thus “polluting the exact thing you’re trying to measure,” he said. “You are massively biasing the measurement every time you do that.”
Zubrinich noted that while systems based on subjective measures of tiredness, like the Karolinska Sleepiness Scale (KSS) used in European legislation, comply with the European General Safety Regulation 2021/1341, they are only required to detect whether a driver is dangerously drowsy 40 percent of the time to pass the test. One such Tier 1 system was tested publicly by German technical services firm TÜV Rheinland during the InCabin Brussels event in June 2023.
“The system detected dangerous levels of drowsiness 55 percent of the time and passed the test,” Zubrinich said. “So, 45 percent of the time, if someone gets dangerously tired, this system will let them have microsleeps while driving.”
Are There Effective Countermeasures?
While the University of Iowa researchers found lane departure warnings and drowsiness notifications were ineffective when used in isolation, they did find that when combined, driving performance improved (i.e., lane departures were less frequent), and drivers kept their eyes open more (PERCLOS or the percentage of eyelid closures was reduced).
This finding, they wrote, “suggests a mechanism in which the DN/LDW countermeasure reduced lane departure frequency by increasing alertness in situations where a lane departure was likely to occur,” proving that “pairing the two systems was more effective” than not.
According to Dr. Morgan, driver monitoring systems tuned to alert this late in the game, perhaps to avoid giving false or excessive drowsiness warnings, are putting drivers at risk. “Both PERCLOS and lane departure warnings are late-stage indicators of drowsiness,” he said. By the time a combination of these warnings is given, Zubrinich explained, the driver is dangerously drowsy and should already be off the road resting or napping.
“The main problem with drowsy driving countermeasures is that they don’t fix the underlying issue,” Dr. Schwarz said. “The driver is still operating in an impaired state. Also, many drivers will not want to stop for a rest or nap during a trip, so they’ll push on through. This is why the best countermeasure is getting good sleep and enough of it.”
Future Considerations & Ongoing Research
NHTSA recommends getting a good night’s sleep and avoiding alcohol intake before embarking on a long drive. Be sure to check for drowsy warnings on prescription and over-the-counter medications. If you’re traveling alone, it’s best to avoid driving during peak sleepiness periods, typically from midnight to 6:00 a.m. or in the late afternoon. No matter when you’re driving, especially if you’re alone, it’s essential to stay alert for signs of drowsiness, such as droopy or tired eyes, swerving over roadway lines, or hitting a rumble strip.
Dr. Gaspar’s research team in Iowa continues to focus on impaired driving, including drowsiness, distraction, alcohol, and cannabis. More information on the NADS-1 simulator is available through the official website of the Driving Safety Research Institute at the University of Iowa.