
The experts we spoke with and the data we analyzed with them point to a collective apex regarding the safety of vulnerable road users (VRUs). In other words, it’s not one singular element or happening but rather a collection of risk factors that have converged and continue to put non-motorists at risk.
State of Road Safety For VRUs
In 2021, the most recent year of national data available, the National Highway Traffic Safety Administration (NHTSA) reported that 7,388 pedestrians and 966 cyclists were killed on U.S. roads in crashes with motor vehicles. The 2021 figures from NHTSA represent the most pedestrian fatalities since 1981 and the most cyclist fatalities since 1975.
Whether pedestrians, cyclists, scooter riders, motorcyclists, individuals operating wheelchairs or other personal mobility devices – or emergency, safety, and road workers – the question is, why are these vulnerable road users (VRUs) less safe now than they were 40 years ago?
We asked experts from the AAA Foundation for Traffic Safety (the Foundation), Guidehouse Insights, the Michigan Office of Highway Safety Planning (Michigan OHSP), the National Safety Council (NSC), and the Vulnerable Road User Safety Consortium SAE-ITC (VRUSC). They weighed in on the state of road safety for VRUs and the causes for the uptick in deaths and injuries.
Growing Concerns & Disparities
Brian Tefft, principal researcher at the AAA Foundation for Traffic Safety, conducts and manages research on various traffic safety issues, from distraction and impairment to pedestrian safety. Tefft and his Foundation colleagues have become increasingly concerned about the safety of VRUs.
“Throughout the 1980s, 1990s, and most of the first decade of the 2000s, the number of pedestrians and bicyclists killed in crashes with motor vehicles on U.S. roads was steadily decreasing,” he said. “However, after reaching a record low in 2009, the trend reversed. Now, we have almost completely negated three decades of progress in just over one decade.”
This increase in crashes involving pedestrians and other VRUs comes at a time when community leaders and residents across the U.S. are pushing for sustainable and transit-friendly options for getting around, whether walking, biking, using a scooter, or taking public transport. Research shows that residents do want to walk and bike more but are nervous about their safety.
For example, in a 2020 State of the State Survey referenced in the Michigan Department of Transportation November 2023 Vulnerable Road User Safety Assessment report (page 23), 75 percent of the 1,000 residents who responded felt “somewhat safe” while walking. By contrast, 48 percent felt “somewhat safe” while bicycling. 40 percent said they would walk more often if roads were safer, while 26 percent said they would bike more if road safety improved.
Lisa Spellman, director of the Vulnerable Road User Safety Consortium, is an expert on transportation-related topics, including human mobility and transportation safety. She sees a significant disparity between the safety of vehicle occupants and VRUs.
“What is disappointing and even confounding is that while it is as safe as it has ever been to be an occupant in a moving vehicle, the rates of injury and deaths continue to rise in most parts of the world for those outside of a moving vehicle,” she said.
What Is Causing The Uptick?
The tragic rise in VRU deaths and injuries since 2009 is something U.S. researchers are looking into from all angles. Whether studying driver behavior, evaluating dangerous stretches of roads, implementing community surveys and listening sessions, or creating and testing models for safe road design. The experts we spoke with offered a deeper understanding of the leading causes of the uptick, illuminating the challenges ahead:
- Distracted and risky driving, especially speeding.
- Preponderance of vehicle-centric infrastructure.
- Larger, heavier, and more powerful vehicles.
Distracted & Risky Driving
Katie Bower, director of the Michigan Office of Highway Safety Planning, began her career with the Michigan State Police in 1994. In her current role, she provides leadership in identifying state and local traffic safety issues and promoting programs and strategies to address them. Through her work, Bower aims to influence driver behavior to help reduce crashes, injuries, and fatalities on Michigan roadways.
“The causes of nearly all vulnerable road user crashes and fatalities are found in driver and pedestrian behavior,” she said. “Talking on their cell phone or getting lost in other distractions, driving recklessly, not heeding traffic signals or signs, road rage, and other factors add to the growing problem.”
As we explored in December 2023 when it was released, the 2022 Traffic Safety Culture Index (TSCI) from the AAA Foundation for Traffic Safety, took a close look at these behaviors. For the first time in the history of the decade-plus TSCI study, the Foundation categorized drivers into six profiles based on self-reported behaviors. The profiles were as follows, classified by highest to lowest percentage in the study:
- Safe: The silver lining is that about 41 percent self-reported as safe drivers, meaning they did not participate in any of the risky behaviors listed below in the last 30 days.
- Speeding: 22 percent reported as chronic speeders, including in residential areas.
- Distracted & Aggressive: 17.3 percent reported a combination of distracted, speeding, and aggressive driving behaviors, including running red lights and switching lanes erratically.
- Distracted: 15 percent self-reported as distracted drivers, including texting while driving.
- Most Dangerous: 2.4 percent exhibited all types of bad behavior, from distraction and speeding to intoxication and aggression. This group also admitted to not wearing a seat belt.
- Impaired: A small percentage, just 1.3 percent, self-reported in this category.
NHTSA’s Fatality Analysis Reporting System (FARS) allows for isolating such factors, like the ones above, and seeing their impact. For example, if a visitor asks how many non-vehicle occupants (pedestrians, cyclists, and others) were killed by distracted drivers in 2021, the number that comes up is 644.
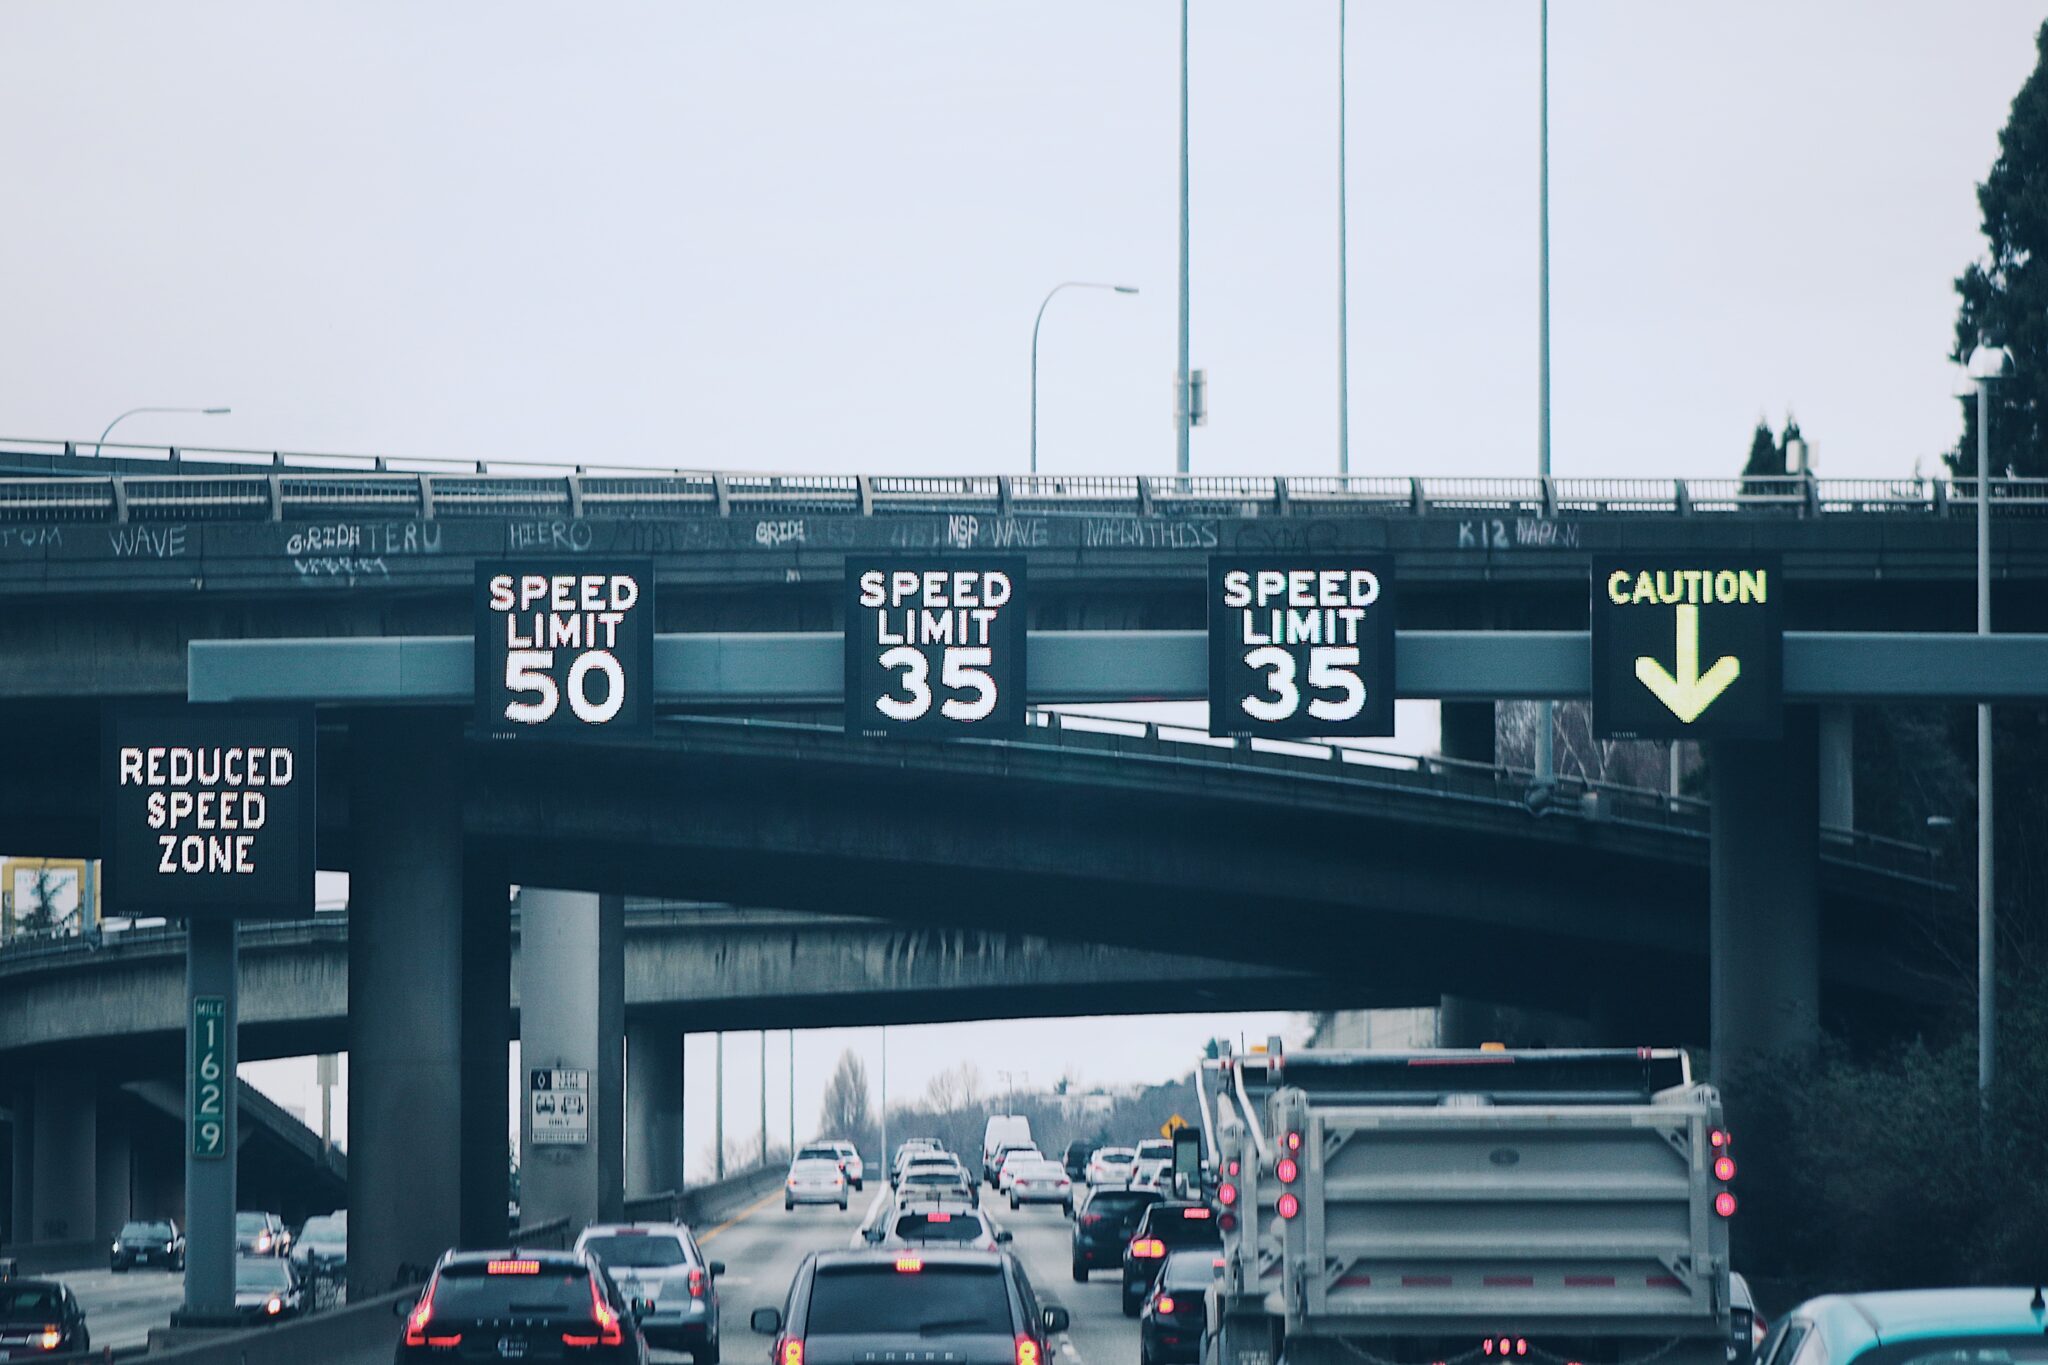
Are Speed Limits Too High?
In the aforementioned 2022 TSCI study, 22.7 percent of the 2,499 respondents said they drive 15 miles per hour over the speed limit on freeways and 10 miles per hour over on residential streets. Although distracted and impaired driving is dangerous, speeding was identified by the experts we spoke to as the most concerning relative to VRU safety.
“A key variable in vulnerable road user safety is speed, both in terms of the design and speed limit of the road and individual drivers’ decisions regarding the speeds at which they drive,” the Foundation’s Tefft said. “The speed at which a person is struck by a vehicle is the most critical factor in determining the outcome, that is, do they live or die?”
Tefft cited Foundation data showing nearly 90 percent of pedestrians hit by vehicles traveling at 25 miles per hour will survive, whereas at 35 miles per hour, about one-third of them will die, and at 45 miles per hour, two-thirds will die. “We’re seeing more and more pedestrians being hit by vehicles on roads where the design of the road and the speed of traffic dictate that the odds of survival are not good,” he said.
Jim Hemphill, senior program manager of mobility safety strategy at the National Safety Council, supports NSC initiatives around the future of mobility safety. He serves as the supporting staff member for the Road to Zero Coalition, a group of over 2,000 organizations and individuals working toward zero deaths on U.S. roadways.
Hemphill affirmed that speed is one of the most important factors contributing to the recent increase in fatalities and serious injuries for all road users – but his focus was more on regulation. “In some cases, speed limits are set at unsafe levels,” he said. “This is especially true in urbanized areas with a mixture of land uses where you might have people traveling in cars, on bikes, on foot, wheelchairs, scooters, or other means, all occupying the same right-of-way section.”
85th Percentile Rule
According to the National Association of City Transportation Officials (NACTO), traffic engineers use what’s known as the 85th percentile rule when setting speed limits. This rule is a bipartisan infrastructure law the Federal Highway Administration (FHWA) advocates in the Manual on Uniform Traffic Control Devices (MUTCD). Traffic engineers who use this method are instructed to raise the speed limit when more than 15 percent of the population drives faster than posted signs.
“This method forces engineers to adjust speed limits to match observed driver behavior instead of bringing driver behavior in line with safety goals and the law,” NACTO wrote in their City Limits guide. “When it comes to safety, this method is designed to fail.”
Road safety experts widely pan the 85th percentile method. In a recent set of interviews by Joel Rose of National Public Radio (NPR), several such experts indicated they’ve pushed to have the directive eliminated. However, the most recent MUTCD update – the most extensive since 2009 – still includes it, though apparently with less emphasis than before.
“It’s a small step in the right direction, but there’s a lot more that could be done,” said Cathy Chase, President of Advocates for Highway and Auto Safety, in her interview with Rose. “We know that speeding is a big factor in crashes, and we were hoping to see them devalue that rule or get rid of it completely.”

Vehicle-Centric Infrastructure
Infrastructure design was top of mind for every expert we spoke with. The common thread in each discussion being a lack of consideration for VRUs and planning for their safety.
VRUSC’s Spellman explained that, too often, when urban designers and policymakers improve throughput, they expand roadways rather than stepping back to determine how the movement of people and goods can best be accomplished in a given location. “While there have been significant improvements to create safer transportation environments, there are still far too many areas where sidewalks, crosswalks, and dedicated cycling lanes are inadequate or absent,” she said.
Researchers are homing in on crash dynamics associated with these weak areas of infrastructure to provide data that can inform those making improvements.
For example, in a Michigan DOT study of 2018 to 2022 crash statistics for their November 2023 VRU Safety Assessment, researchers found that the location on the roadway where a crash occurs differs when a pedestrian or bicyclist is involved. They discovered that while most crashes occurred on straight roadways, cyclists were more likely to be killed or seriously injured in a driveway or intersection. While intersections are also dangerous for pedestrians, those on foot are more likely to be killed or seriously injured on roadways.
“A troubling statistic is that more than one in twenty pedestrians were killed or seriously injured along freeways – this includes construction workers and motorists outside of their vehicles, such as people changing a tire,” wrote the Michigan DOT. “In areas where motorists have been frequently struck, the available shoulder width may be a factor, though this data point is not widely available to assess.”
Timing & Location
While time of day and year might not seem like infrastructure issues, it’s important to note that weaknesses like poor lighting in high-risk areas for VRUs can have a negative impact. The Michigan DOT researchers, for example, found that dark conditions with artificial lighting accounted for the second-highest number of pedestrian and bicycle crashes. The researchers were unsure whether this was because lighting had been installed in high-risk areas or whether the installed lighting was inadequate.
In Michigan, roads are classified by highway class from Interstates to principal and minor arterials to local roads. 55 percent of Michigan roads are considered local, while 10.5 percent are considered minor and principal arterials.
In the Michigan DOT’s November 2023 VRU Safety Assessment, crash statistics show an inverse relationship with this data. 28 percent of VRU crashes occurred on local roads, while 63.5 percent occurred on arterials. Michigan’s findings map closely to national data.
“A substantial majority of pedestrians killed by vehicles – and virtually all of the increase in pedestrian fatalities since the historic low in 2009 – have been on urban arterials, which are the major roads, typically higher-speed multi-lane roads, built to move vehicles into and out of cities,” Tefft said. “Nearly as many pedestrians were killed on urban arterials alone in 2021 as were killed in total on all roads combined in 2009 (3,973 versus 4,109 deaths, respectively).”
“When focusing on fatal and serious injury pedestrian and bicycle crashes, the numbers are clear: focusing our attention on arterial roadways offers the greatest potential for decisively reducing the number of fatal and serious injury pedestrian crashes on Michigan’s roadways,” wrote the Michigan DOT.
Larger & More Powerful Vehicles
Vehicles, whether sedans, SUVs, or light trucks, are bigger, heavier, and more powerful than at any other time in history. The 2023 EPA Automotive Trends Report revealed the footprint, weight, and horsepower of 2022 model-year vehicles were at historical highs. Since 2008, vehicle footprint has increased by six percent. Since 2004, weight has increased by five percent, and horsepower has increased by 23 percent.
Mechanical engineer and automotive journalist Sam Abuelsamid has studied and reported on a number of key industry trends over the years, including vehicle size and weight. Abuelsamid, principal analyst of transportation and mobility at Guidehouse Insights, has over 20 years of experience as a product development engineer, which includes an emphasis on embedded software and architecture.
“When it comes to size, the trend over the past several decades is that individual nameplates have tended to get larger and heavier from one generation to the next,” Abuelsamid explained. “For example, a Honda Civic or Toyota Corolla today is larger and heavier than an Accord or Camry of 15 to 20 years ago.”
“Over that same period [since 1975], power has nearly doubled, making vehicles faster and in many cases more difficult to control,” Abuelsamid continued, citing the 1995 and 2024 Ford Rangers as an example.
In 1995, the optional four-liter naturally-aspirated V6 for the Ranger produced 160 horsepower, while the 2024 Ranger with a twin-turbo 2.7-liter EcoBoost V6 cranks out 315 horsepower. The off-road intensive Ranger Raptor variant uses a more muscular EcoBoost V6 to deliver 405 horsepower and 430 lb-ft. of torque.
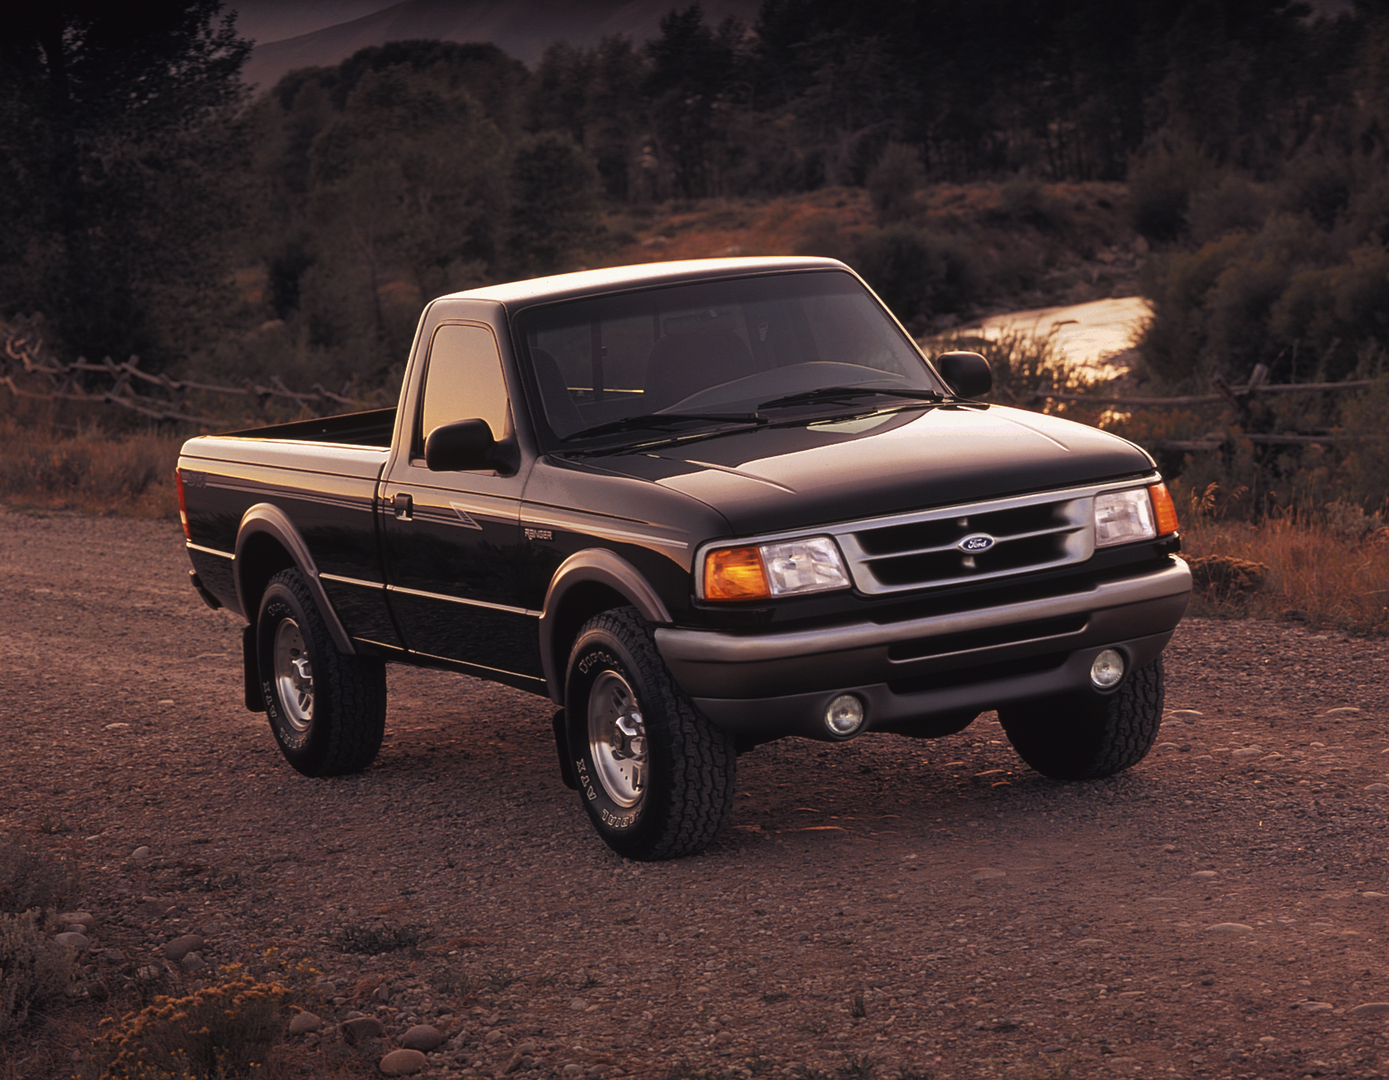
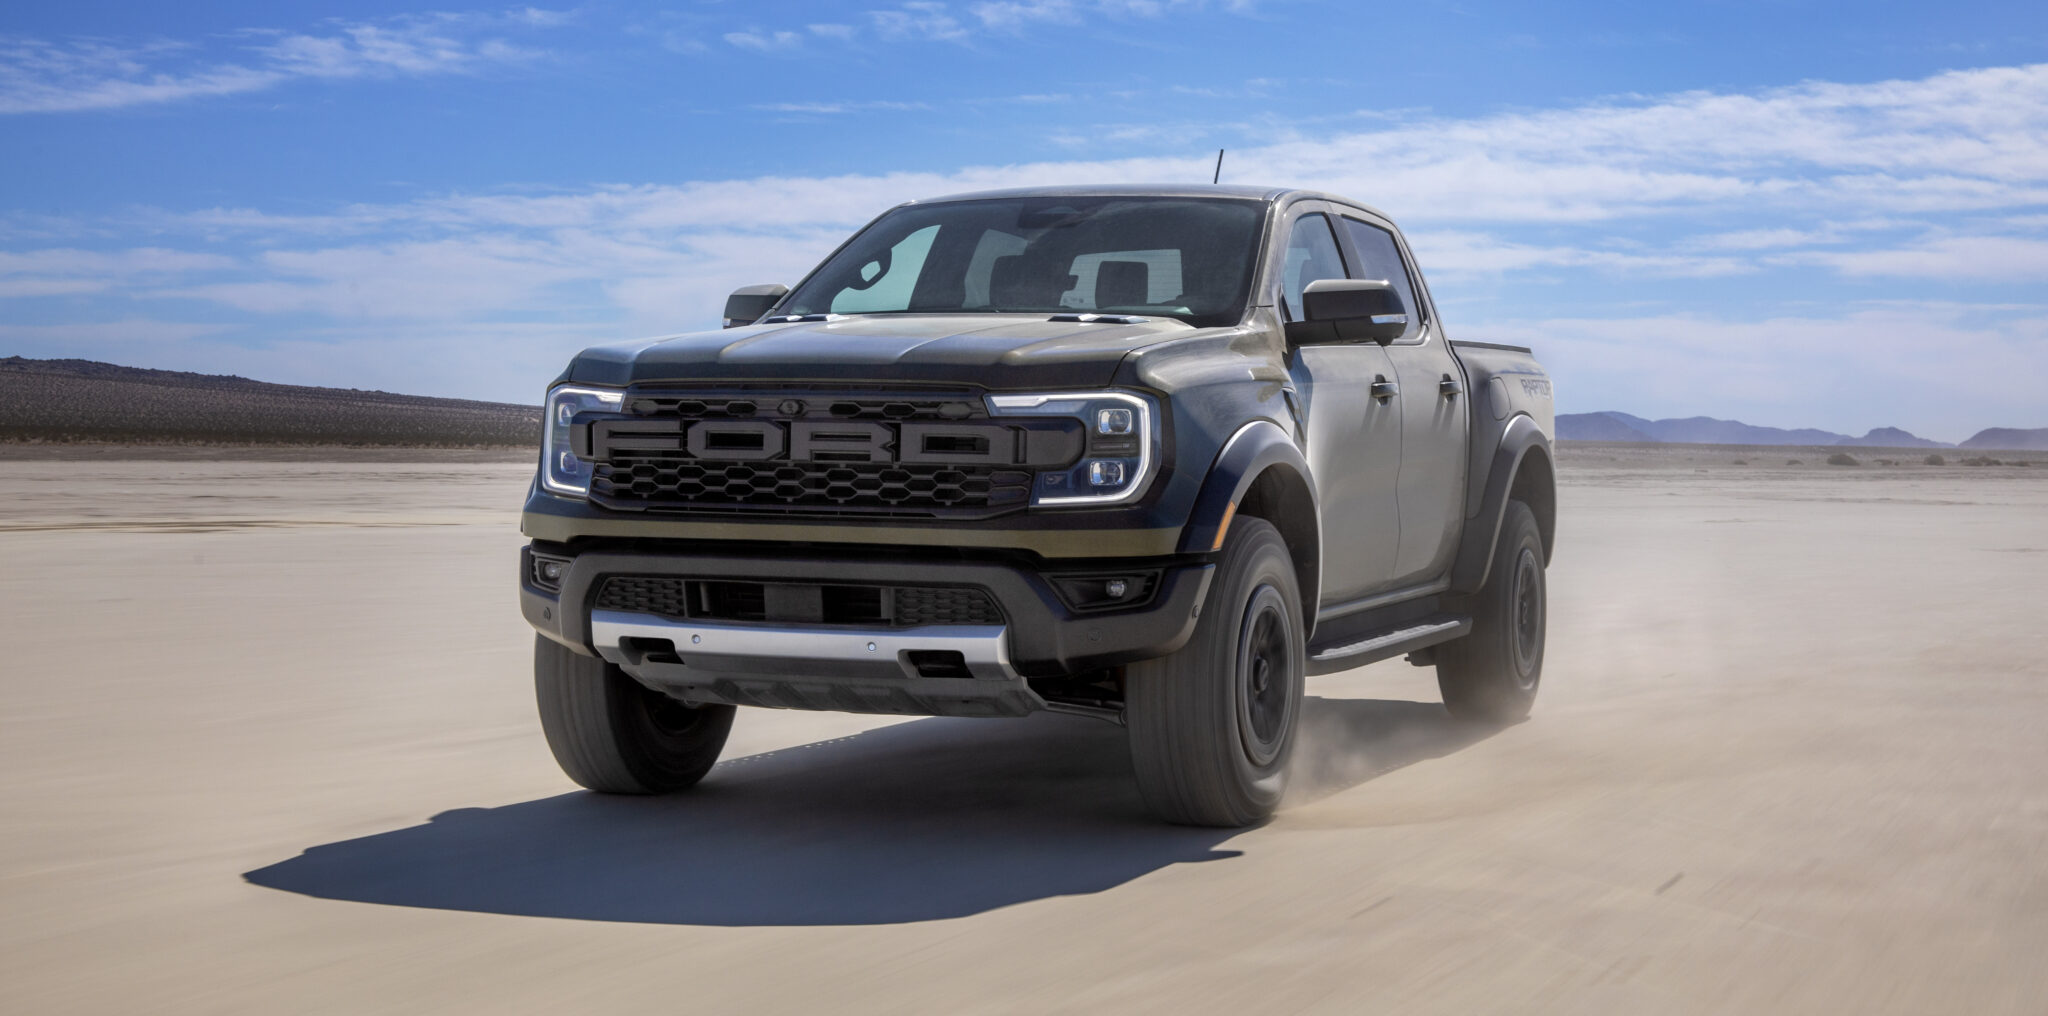
1995 Ford Ranger (left) and 2024 Ranger Raptor (right). Photos: Ford Motor Company.
Electrified Vehicles
Regardless of whether Americans are buying a truck, sedan, or an SUV, as they gravitate toward EVs, they’re embracing, perhaps unwittingly, more weight and power.
For example, a 2024 Hyundai Kona with a gasoline engine has a curb weight between 3,005 lbs. and 3,505 lbs., depending on drivetrain options and trim level. The 2024 Kona’s standard engine for the SEL trim level, a naturally aspirated 2.0-liter four-cylinder, produces 147 horsepower and 132 lb-ft. of torque.
By contrast, the 2024 Hyundai Kona Electric has a curb weight between 3,517 lbs. and 3,891 lbs., depending on the trim level. The SEL trim level’s electrified powertrain, complete with a 64.8 kWh battery pack, produces 201 horsepower (150 kW) and 188 lb-ft. of torque.
“This problem is getting worse with EVs because everyone is trying to catch up with Tesla and putting too much power into their electric vehicles to try to match Tesla’s performance levels,” Abuelsamid said. “Electric motors also produce maximum torque from zero speed while internal combustion engines have some lag after you step on the pedal before they start to accelerate. This makes EVs harder to control for poorly trained drivers.”
“Many newer vehicles, especially EVs, are heavier and have greater impact force, which can cause more severe injuries in collisions with VRUs,” Spellman explained. “This increased weight matters because the kinetic energy of a moving vehicle is proportional to its mass so that a heavier vehicle will have more kinetic energy than a lighter vehicle at the same speed.”
Average Vehicle Age & Design Considerations
The average age of vehicles in operation (VIOs) on American roads is also at a historic high of 12.5 years, according to S&P Global. This may mean we have yet to see the full impact of late-model vehicles that are heavier and more powerful.
S&P Global Mobility reported in May 2023 that 63 percent of all VIOs on American roads today are light trucks or SUVs. And nearly 80 percent of new car registrations in 2022 were for light trucks or SUVs. S&P Global Mobility projected that by 2028, 70 percent of all VIOs will be in that category.
“The dramatic growth in size, weight, frontal hood height, and power of vehicles being sold over the last 20 years or so, creates large blind spots and contributes to worse crash outcomes for those outside of the vehicle,” NSC’s Hemphill said.
Newer designs intended to improve occupant safety and crash outcomes may exacerbate the problem for pedestrians and cyclists. For example, the pillars of newer vehicles tend to be thicker to meet occupant safety standards such as rollover and side-impact protection, Abuelsamid explained. In the right conditions, be it traffic or weather, these more prominent blind spots may reduce a motorist’s ability to see a VRU. At the same time, heavier and taller vehicles with more power can worsen crash outcomes.
“Features like rear seat headrests that were rare in prior decades are now common to provide protection for passengers in the event of a rear impact also obscure vision,” Abuelsamid said. “There has also been increased adoption of off-road-oriented pickups and SUVs that sit even higher, making the problem worse.”
Collective Apex
The experts we spoke with and the data we analyzed with them point to a collective apex regarding VRU safety. In other words, it’s not one singular element or happening but rather a collection of risk factors that have converged and continue to put non-motorists at risk.
In addition to the points discussed above, the experts we spoke with also highlighted impaired driving as a significant factor in the uptick in VRU fatalities and injuries. In particular, the number of states that have approved the use of recreational cannabis was, and will continue to be, an area of concern.
These and many other factors will assuredly be studied by researchers, officials, and safety advocates as they work to gather more data and the community sentiment needed to “flip the script,” so to speak, on what U.S. Transportation Secretary Pete Buttigeg in May 2022 called “a national crisis of fatalities and serious injuries on our roadways.”
*Melissa Malley, a writer in Los Altos, California, contributed to the research and writing of this article.